
Workplace analytics software that shows you the office you actually need
See how desks, spaces and teams are using your workplace, not just how much space you have.
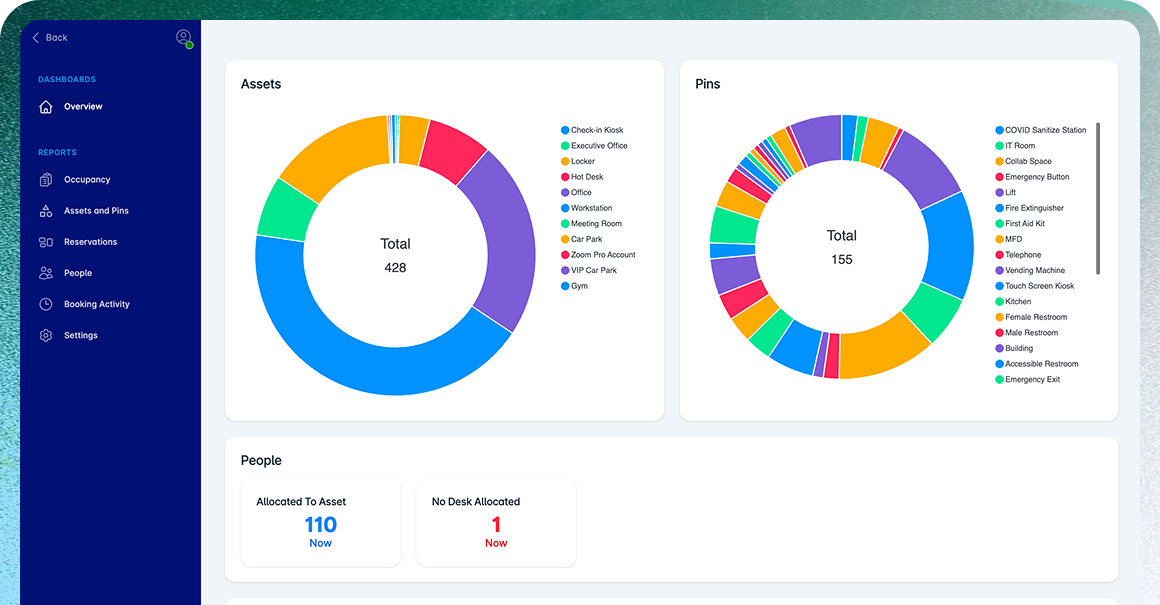
You know how much office space you have. Do you know how much you use?
You might have 120 desks.
 But how many are occupied on an average Tuesday?
- Which teams regularly run out of space?
- Which neighbourhoods sit half-empty?
- How many people book a desk and never check in?
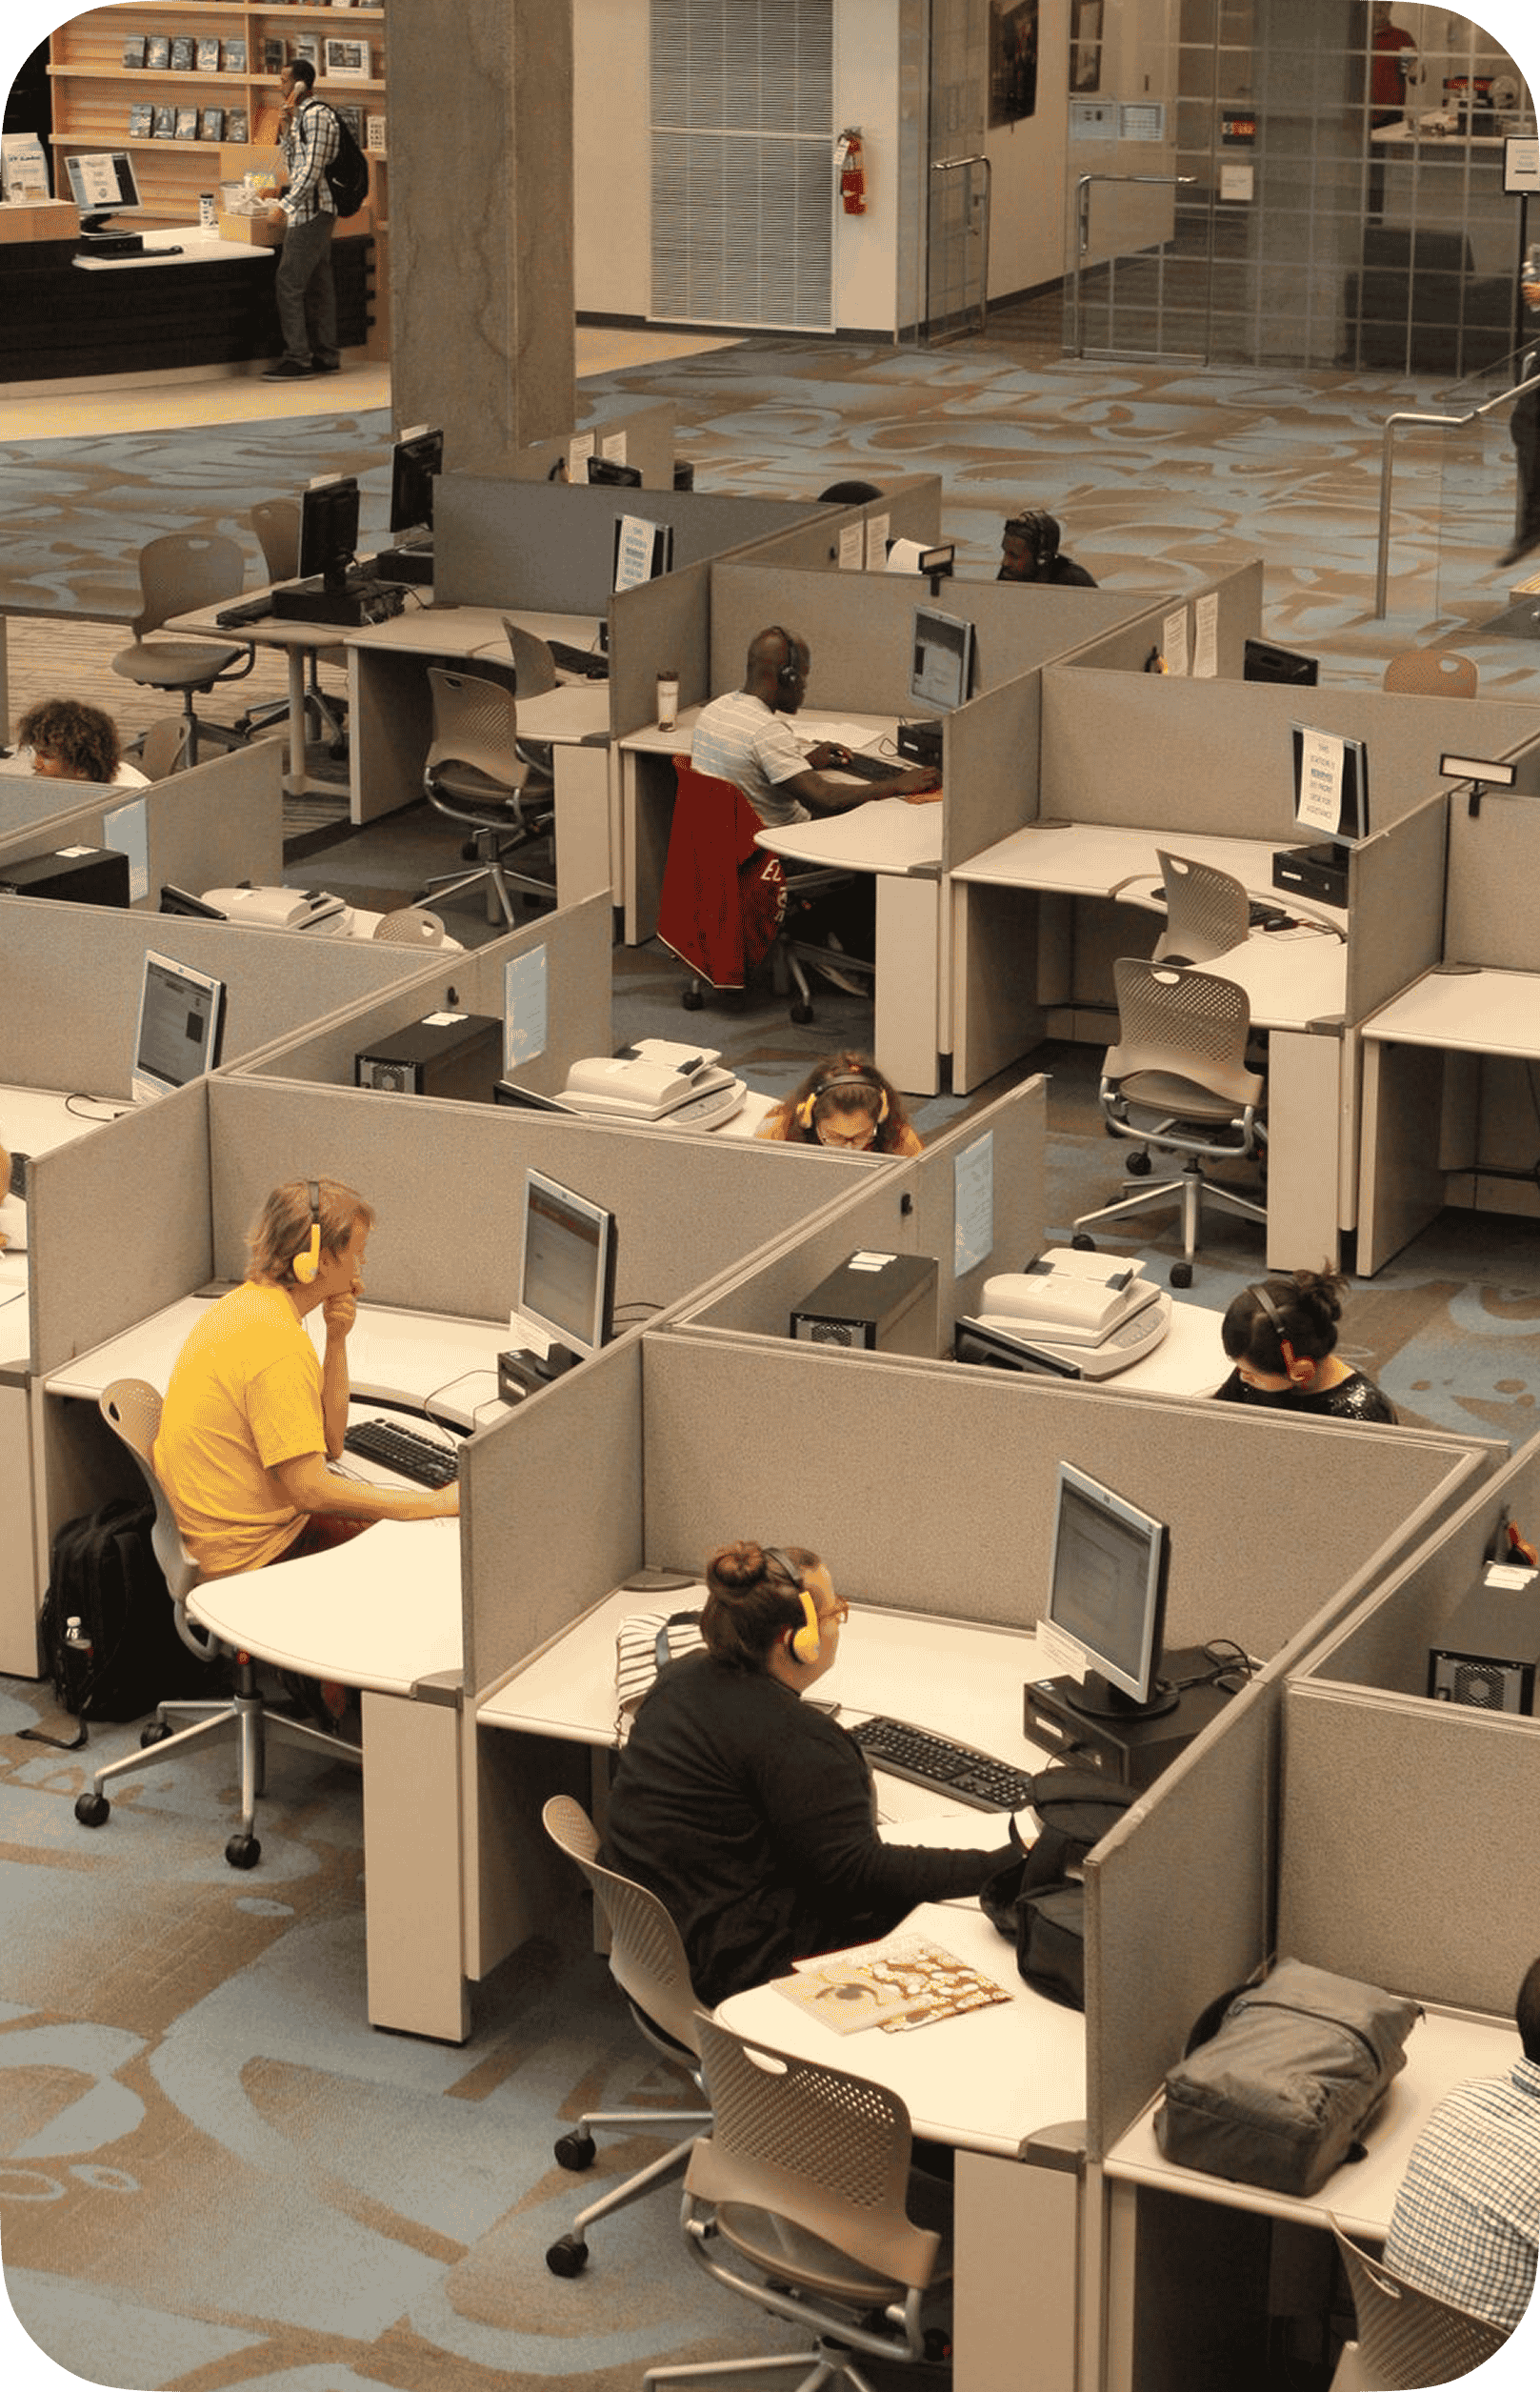
See where your workplace is full. And where it isn’t.
OfficeMaps occupancy reporting helps you understand how space is being used across your organisation.
Analyse occupancy by:
 LocationCompare workplace usage across offices and sites.
 FloorSee where capacity is being used or sitting idle.
 NeighbourhoodUnderstand whether team areas are over or under-allocated.
 Team and departmentSee how different groups use the space assigned to them.
 DayIdentify patterns in when employees actually use the office.
- Instead of treating every desk equally, see where demand actually exists.

Stop allocating space based on headcount alone
A team of 50 employees doesn’t necessarily need 50 desks.
OfficeMaps helps you compare the space allocated to a team with how much of that space they actually use.
If one neighbourhood has 12 desks but regularly uses only a fraction of them while another is consistently full, you have the data to reconsider the allocation.
Know the difference between booked and used
A booking tells you someone intended to use a desk. A check-in tells you whether they actually arrived.
OfficeMaps reports on reservations and no-shows, helping workplace teams identify desks that appear unavailable in the booking system but aren't actually being used.
 upcoming desk reservations
- available capacity
- employees who failed to check in
- no-show patterns over time
- persistent no-shows
See tomorrow’s demand before tomorrow arrives
Workplace planning shouldn’t only look backwards.
OfficeMaps booking forecasts show how many desks are already reserved and how many remain available for upcoming dates.
See demand by neighbourhood and location before employees arrive, giving workplace teams more visibility into where capacity could become tight.
Can three floors become two? Start with the data.
Real estate decisions are too expensive to make from assumptions. OfficeMaps gives facilities and workplace teams utilisation data to help answer bigger questions:
 Are we paying for space employees rarely use?
- Could teams share space more effectively?
- Do some departments need more desks while others need fewer?
- Which office days create the highest demand?
- Could we consolidate floors without creating capacity problems?
The goal isn't simply to increase utilisation. It's to understand how much of the workplace your organisation actually needs.
From a single desk to the whole workplace
Workplace utilisation looks different depending on the question you're asking.
OfficeMaps lets administrators analyse workplace data across different levels of the organisation, from individual assets and neighbourhoods to floors, locations and sites.
So you can investigate a specific resource or step back and understand broader workplace patterns.
Meeting room booking that fits the rest of your workplace
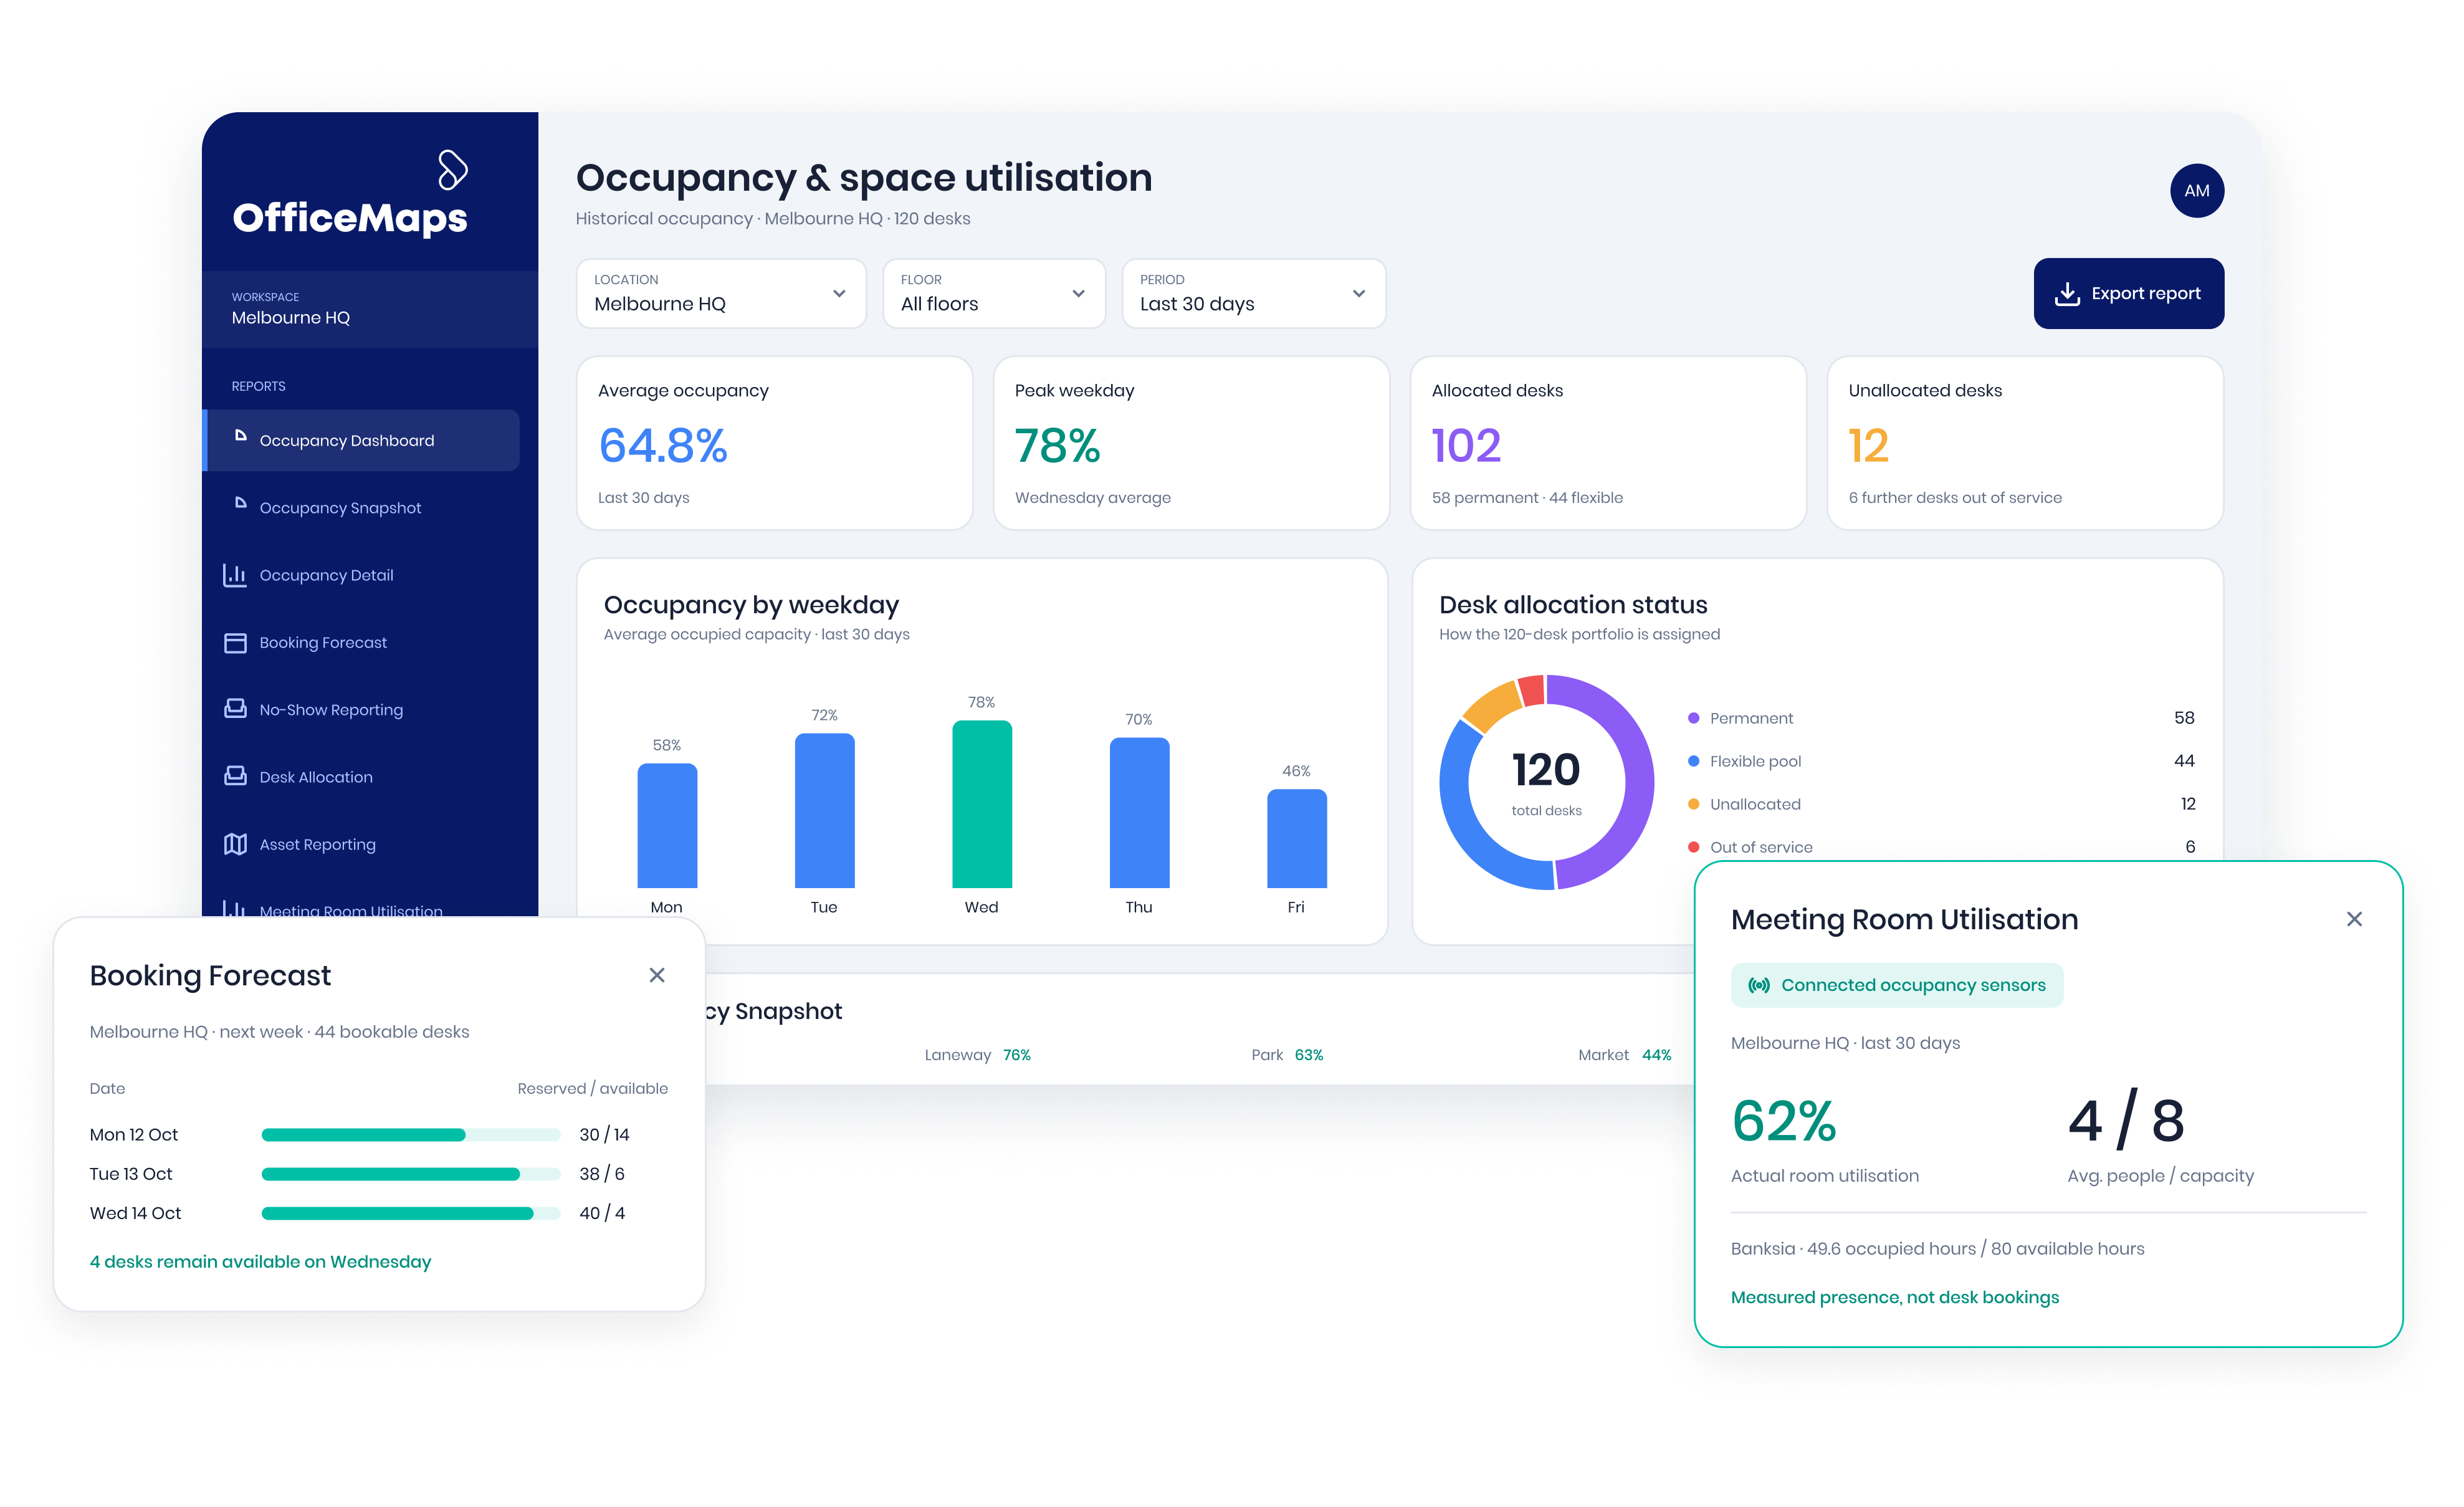
 Occupancy DashboardTrack historical desk occupancy across your organisation, locations and sites.
 Occupancy DetailTrack historical desk occupancy across your organisation, locations and sites.
 No-Show ReportingUnderstand when reserved desks aren't actually being used.
 Asset ReportingUnderstand the assets and workplace resources available at each location.
 Occupancy SnapshotIdentify neighbourhoods that may be over or under-utilised.
 Booking ForecastSee future reservations and remaining desk availability.
 Desk Allocation ReportingTrack how desks are allocated across employees and departments.
 Meeting Room UtilisationUse connected occupancy sensor data to understand actual room utilisation and capacity.
Workplace analytics that connects back to the workplace
Analytics is more useful when it isn't sitting in a separate system. OfficeMaps connects workplace reporting with the same platform used to manage:

 Desk bookingSee demand created through employee reservations.
 Employee presenceUnderstand who is using the workplace.
 Team neighbourhoodsCompare allocated space with team usage.
 Interactive office mapsConnect workplace data to physical locations.
 Meeting rooms and workplace resourcesUnderstand utilisation beyond desks.
That creates a clearer picture of how people and space interact across the workplace.
See the pattern.
Then change the workplace.
The value of workplace analytics isn't another dashboard. It's knowing what to do next.
- Redistribute desks between teams
- Adjust neighbourhood allocations
- Plan for high-demand office days
- Release capacity being lost to no-shows
- Reconsider floors that consistently sit underused.
Make future workplace decisions with evidence behind them.
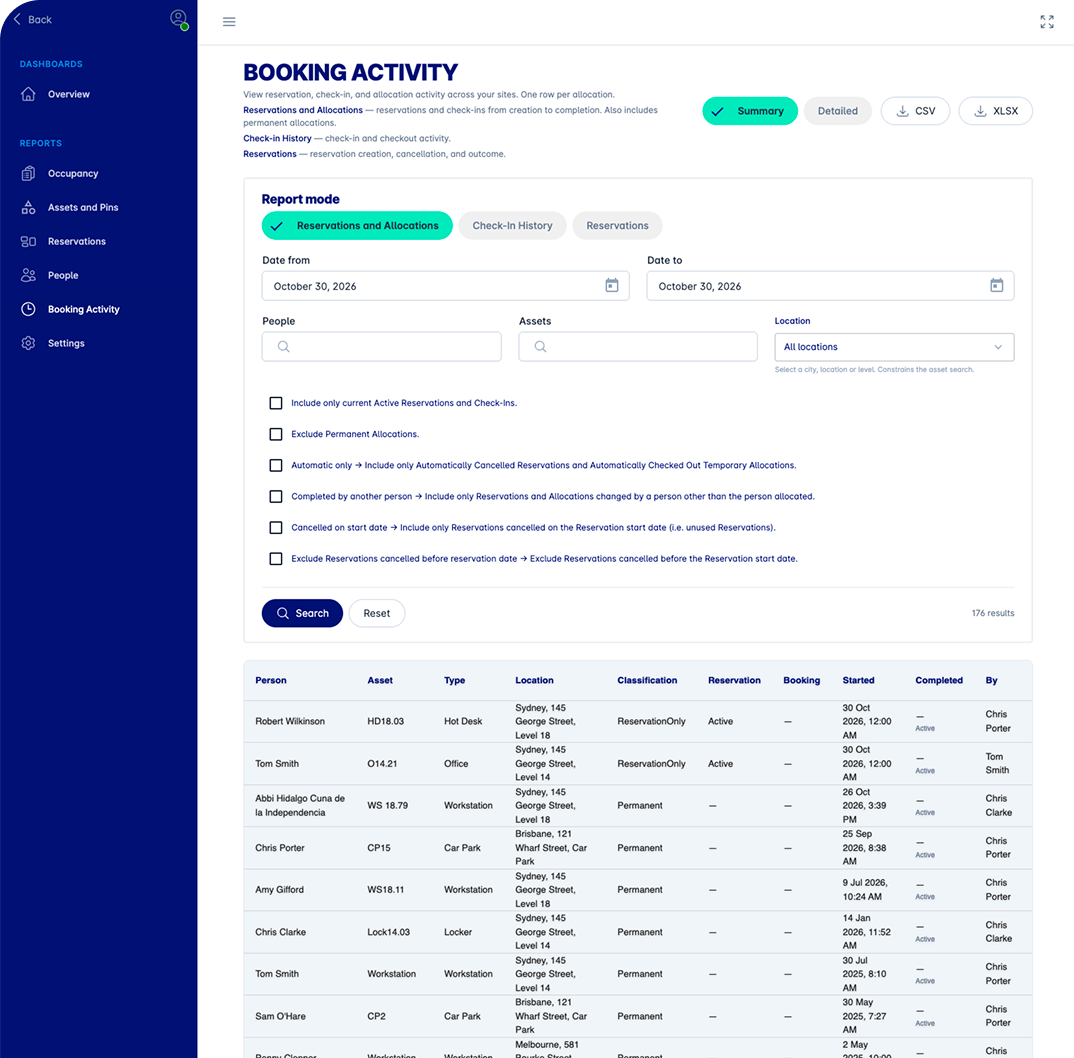
Your workplace is already generating the data. Use it to decide what comes next.
See what’s occupied, what’s underused and where your workplace actually needs space.